Green Landscaping Group (OM: GREEN) is a Swedish company providing landscaping and maintenance services for outdoor environments to the public and private sectors. The company is a so-called serial acquirer and leading player within a highly fragmented market. I believe that the business offers an interesting, relatively low-risk roll-up opportunity that is currently trading at fair value, with the potential for 15% IRR without the need for multiple expansion. The investment case can be summarised in the following points:
GLG operates in a stable, non-cyclical market that exhibits mid-single digit annual growth on average. Furthermore, this market demonstrates a high degree of localisation and fragmentation with GLG, despite being a leading player, holding a market share below 5%. Moreover, in recent years the company has expanded its operations beyond the Swedish borders, thereby amplifying the potential for market consolidation. The combination of organic and inorganic growth avenues positions the company favourably to achieve sustained double-digit growth rates over an extended period of time.
The company is led by CEO Johan Nordström, who together with most of his team has been running the business since 2015 after turning around the company’s strategy from its inception in 2009. Since his appointment, the focus has been on profitable growth through a decentralised structure and operational efficiency, heavily inspired by the DBS framework from Danaher Corporation. Management owns >20% of the company with 6.6% owned by Johan Nordström and 1.7% by GLG’s chairman of the board and Instalco’s CEO Per Sjöstrand.
GLG currently trades at a 5% reported UFCF yield adjusted for financial leases. Through a continuation of organic growth in line with the market, disciplined acquisitions and slight margin improvements, I derive a fair value range of approximately SEK 70-78 for 10%-15% IRR.
Note: this write-up will be less detailed and more to the point than usual due to time constraints. For more detailed discussions, feel free to reach out through this platform or twitter.
Green Landscaping Group - Business Model
The company consists of 49 operating subsidiaries and is active within three main service areas:
Ground maintenance (~50%): largest service area concerned with renovation and maintenance of grounds and green areas. Typical work involves cleaning, lawn mowing, pruning, planting, harvesting and road maintenance. Contracts typically run for three to five years, with the option to extend for an additional two to four years. For housing cooperatives, contracts are typically one year, with annual renewal. Customers are primarily county councils, municipalities, property managers, property companies and others who own or manage green areas
associated with urban development.
Landscaping and construction (~35%): design and construction of green
outdoor environments. This service is not limited to just planting trees and plants, but also includes factors like soil quality, drainage, and irrigation systems to ensure the long-term health and sustainability of the landscape. Project areas include marketplaces, residential outdoor environments, parks, churchyards, playgrounds and recreation sites with 3-6 month contracts valued in the range of SEK 1–20 million. Furthermore, landscaping and construction services exhibit a close interrelation with ground maintenance services and are often seen as an upsell opportunity within the scope of ground maintenance contracts. Customer mainly include municipalities, municipal companies and construction companies.
Road maintenance and snow & ice removal (15%): the name explains itself. This service area is obviously more seasonal in nature, with contracts often starting in September running through early May at the latest. Contracts include fixed prices for resource readiness, as well as remuneration for each service occasion. Apart from regular snow and ice removal, the company also offers de-icing preparations through salt/sand/gravel mixtures, including collection services by sweepers post-season. If you are a heavy advocate of global warming and believe that the Nordics will be the next Costa del Sol, you might want to write off this income steam.
As mentioned before, many of the company’s maintenance contracts extend over multiple years of time. This naturally imposes a risk of cost inflation, which has especially been a relevant topic as of late. Nevertheless, this risk is mitigated by the fact that most of the customer agreements with a longer duration contain indexation clauses that adjust prices based on inflation. These indexations typically occur on an annual basis, which is why there is a small delay between costs elevations and price adjustments.
The company has three main financial targets, namely (i) 10% annual growth (both organic and inorganic), (ii) 8% EBITA margin and (iii) pro forma ND/EBITDA of below 2.5x GLG strategy focuses on profitable growth, that combines single-digit organic growth rates with a decentralised acquisition approach. The company describes targets with annual sales between SEK 30-150 million to be the sweet spot with further focus on (i) possibility of achieving synergies in delivery and purchasing, (ii) long-term customer relationships and profitable contract portfolios, (iii) strong local brands and (iv) skilled entrepreneurs who have fostered a healthy organisational culture with competent management teams. On top of this, GLG also performs smaller bolt-on acquisitions with annual sales around SEK 20 million that require the same criteria but often are integrated/absorbed into existing operations post-acquisition. As said above, GLG utilises, like many serial acquirers, a decentralised approach where acquired companies operate as an autonomous subsidiary with their own PnL. Acquisitions are commonly also partly financed through equity in order to bring the entrepreneurs on as investors in GLG.
Below you’ll find a self-compiled overview of historic acquisitions. Note that annual sales figures are taken from the company’s reports, whereas paid multiples are my own rough estimations. These estimations also do not take acquired net cash (debt) into account, hence the real multiple paid is most likely a bit lower. If I had a gun to my head, my conclusion would be that GLG pays around 5x EV/EBITDA for its acquisitions and targets 15%-20%+ returns on their investments.
A final, yet important, note of the company’s strategy is their focus on profitability enhancements and efficiency through an internal control system and team called LEAN. This system is based on four cornerstones: planning, daily control, continuous improvement and ongoing follow-up. These cornerstones aim to facilitate higher work efficiency, improved processes and reduced costs. The LEAN team serves as a catalyst for spreading best practice between companies and is led by Pierre Kubalski, who takes inspiration from his ex-employer Danaher and their approach of focusing on creating a culture of continuous learning and improvement (i.e. Kaizen).
Green Landscaping Group - Industry & Competition
GLG operates in a large, non-cyclical market that is highly fragmented and localised with over 18.000 companies in the Nordics alone. The presence of fragmentation becomes evident as the aggregate market share held by the leading three players in each Nordic country is below 15% (often even below 10%). The company estimates its addressable market to total around SEK 105 billion, split between Sweden (SEK 40b), Norway (SEK 44b) Finland (SEK 16b) and Lithuania (SEK 6b). This corresponds to a current market share of approximately 7% in Sweden, 4% in Norway and 1% in Finland and Lithuania combined. However what is perhaps more interesting is that GLG recently entered the German market through its acquisition of Schmitt & Scalzo GmbH. The CFO mentioned during a recent presentation that the DACH market is similar to the Nordics, meaning lots of smaller players with less large competitors. Furthermore, it was mentioned that the amount of companies in Germany alone is about 4x the size of the Nordic market, significantly enhancing the company’s opportunity and runway for market consolidation.
The Swedish market has historically grown around 4%, which due to low inflation has mainly been volume driven. Moreover, municipal spending as percentage of total budget has been relatively low ranging around 5%-6%, making it more immune to budget costs and hence more resilient to economic fluctuations. The Norwegian market has shown slightly higher growth rates, mainly due to increased regulations regarding quality assurances (e.g. special service licenses are required to participate in contract procurements). This has also led to higher price levels and profitability, as service companies can demand higher compensation for skilled labour. Lastly, the Finnish market can be considered the most immature of the three, being much more fragmented than its Nordic peers with top three players holding less than 5% market share.
The company has exposure to both the private and public sectors, being slightly more tilted to the latter (~60%). This market provides stable and recurring income streams through long-term relationships and contracts. Furthermore, the overall market is supported by industry trends such as population growth, urbanization (including higher expectations on green urban areas) and climate change (ESG).
Regarding competitive advantages, customers that offer major contracts often put specific requirements on suppliers and they use structured tendering processes. This creates barriers to entry for smaller companies in the market, which in combination with GLG’s full service offering (from construction to maintenance) provides the business with a competitive edge.
Green Landscaping Group - Opportunities & Risks
Below I’ve summarised my interpretation of the company’s key opportunities and risks.
Opportunities:
Continued market consolidation within existing markets.
Geographical expansion with medium-term focus on the DACH region.
Margin improvement through the internal control system LEAN.
Acquisition of higher margin targets outside of Sweden. For instance, Norwegian targets typically exhibit elevated profit margins attributable to heightened delivery standards, resulting in comparatively higher pricing levels.
Improvement of legacy and underperforming subsidiaries (10 companies with <5% EBITA margin).
Above market organic growth by capturing more market share.
Risks:
Interest rates, which substantially affect the company’s debt levels and cash flows. The recent increase in the interest rate environment is generally not a net positive for serial acquirers, although a positive aspect is that competition for deals decreases.
Poor M&A performance (ROIC < WACC).
Weather conditions. Warm winters result into worse performance for the group.
Increased competition. Barriers to entry are relatively minor for smaller projects, which leads to more competitive tender biddings and hence lower margins.
Green Landscaping Group - Management & Ownership
GLG’s background can be divided into two parts. Firstly, the company was founded in 2009 through the merger of several landscaping businesses by a private equity firm. For several years the company’s strategy was an aggressive focus on net sales growth, but it lacked underlying stability and profitability. Which brings us into the second part which is when current CEO Johan Nordström was appointed in 2015. Together with his team, he managed to build more stability and shifted the strategy to focus more towards improved margins, quality, customer satisfaction and productivity (i.e. profitable growth).
For detailed information regarding the management, follow this link. The common trait one can identify by looking into management’s experiences is a history of turnaround cases and strong focus on efficiency and continuous improvements. Again, lots of inspiration is derived here from Danaher (stated on their own “Our History” page), which is not coincidental given that the head of LEAN operations, Pierre Kubalski, has previous work experience at Danaher.
Management is incentivized through stock warrants and bonus schemes (capped at 50% of fixed annual salary) based on numerous performance metrics such as growth, profitability, working capital, cash flows, leverage levels and other soft factors. However, the main incentive in my opinion is management’s skin in the game. CEO Johan Nordström holds 6.6% of the company’s shares, which equals >50x his annual remuneration. Management (both at group and local levels) own >20% of the shares in total. Other significant shareholders worth highlighting are Staffan Salén (long-time board member / chairman of real estate giant Sagax) and chairman of the board Per Sjöstrand (CEO of Instalco, a serial acquirer within installation services). In conclusion, both the management team and the board demonstrate a commendable level of competence.
Green Landscaping Group - Key Financials
Please note that the figures provided herein and those to follow are solely derived from reported data. The company has not presented pro forma figures, which may result in certain comparisons not being like-for-like.
GLG has undergone an impressive growth journey over the recent years, which for the majority has been driven by acquisitions. During this growth phase, margins have also expanded mostly due to improvements in legacy businesses (older BUs with profitability issues) and margin-accretive acquisitions. From FY18, the company has performed a revenue CAGR of 41.8%, whereas EBITDA has compounded at 76.0% annually.
However, it is important to consider that the company has performed an IPO and a rights issue during this timeframe, utilising the raised funds to accelerate the acquisition strategy. Moreover, the company has used equity to partially finance their acquisitions and provide incentives to local management teams. This has led to a share dilution CAGR of 9.3% over the aforementioned period. Nevertheless, examining the growth on a per share basis still presents remarkable results with a revenue per share CAGR of 29.8% and EBITDA per share CAGR of 61.1%. Evaluating the historic period, my calculations show that approximately 88% of the net sales growth has been driven by M&A and foreign exchange effects, with the remaining 12% being derived from organic initiatives. Again, organic growth rates have historically ranged around 5% for the markets GLG is currently active in. These growth rates have recently been slightly elevated due to a post-covid rebound and higher inflation levels.
GLG has also continuously grown its order backlog alongside the topline growth. Due to the long-term nature of mostly maintenance contracts, the order backlog is not an exact approximation of near-term sales. The back log has historically ranged between 1.5x-2x LTM revenues and still provides, despite the above, certain insights on the company’s sales direction (see correlation between both trajectories).
Examining GLG’s cost base, it’s obvious that main cost items are related to personnel expenses. Direct costs (e.g. project workers, sub-contractors, materials etc.) have averaged around 45.2% over the historical period. Despite some swings (mainly during covid), these costs have remained relatively stable over time in relation to sales. Remuneration to overhead employees has averaged 31.9% historically and has demonstrated more operating leverage over time standing at 28.3% as of the LTMMar23 period. Other external costs and operating expenses experienced slight reclassifications of admin, recruitment and external services costs in FY22, but have as a sum remained stable between 13%-14% of net sales over time. EBITDA margins have, as mentioned before, expanded rapidly during the recent years, going from 4.7% in FY18 up to 11.8% in LTMMar23, resulting into best-in-class margins for its market. However, I consider it unlikely that GLG can continue the expansion trend in a similar pace as it meets natural resource (i.e. people) constraints. I believe incremental margins (~12%-14%) provide a reasonable indication of where the margin ceiling might be.
Looking at GLG’s capital returns in the graph below, we can observe a historical uptrend, which does not come as a surprise given the margin uplift the company has experienced (remember, higher ROIC drills down to margin improvements and/or capital turnover). Due to the acquisitive nature of the business, combined with some capex and working capital requirements, GLG’s capital return ratios are in my opinion mediocre. The positive part is that the company does create value as ROIC > WACC, yet incremental improvements appear to be limited at 12%-13% (see ROIIC). I’ve added an adjusted ROIC calculation that excludes goodwill for illustration purposes, however it’s not a ratio I consider appropriate given the acquisition strategy of the business.
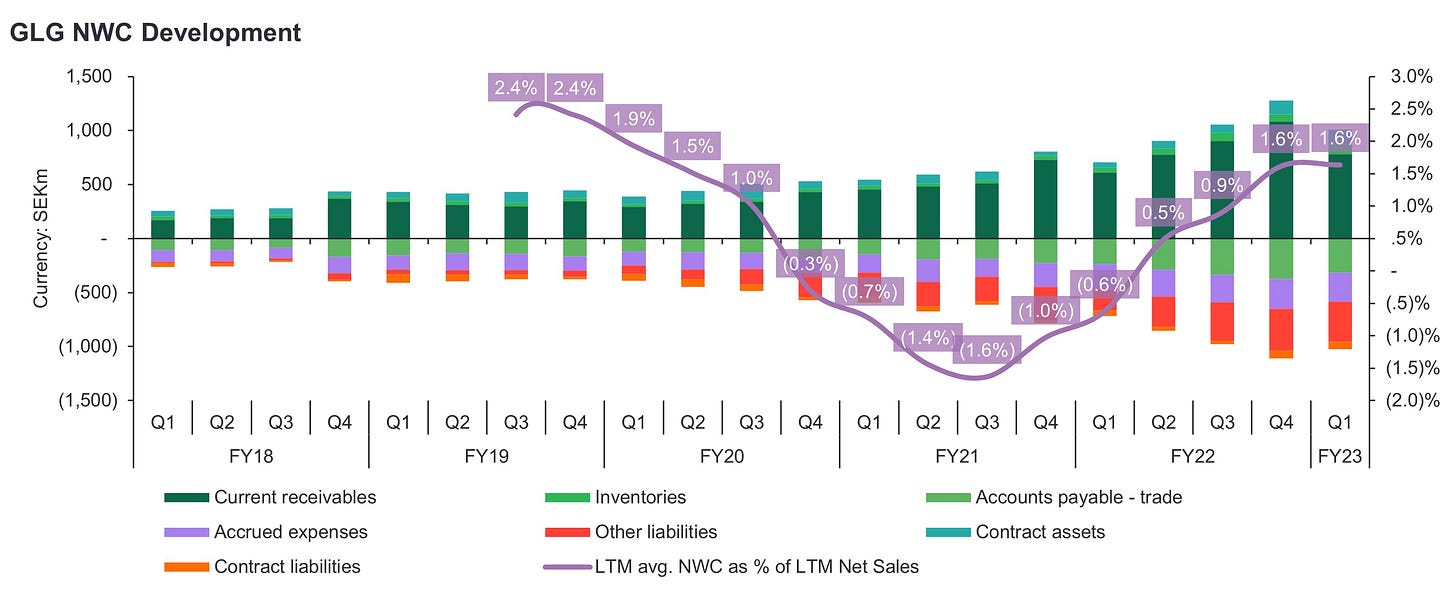
Further examination of the company’s balance sheets shows that the main assets consist of intangibles (i.e. goodwill, customer relationships and brands) and leases, whereas liabilities are primarily related to loans. Net working capital constitutes mostly of receivables, payables and other current liabilities. NWC has historically experienced some swings but seems to average between 1%-1.5% of revenues. Lastly, GLG has had quite some leverage in the past (>3x ND/EBITDA) but currently holds a leverage ratio of 2.2x pro forma EBITDA. I consider this level neither a cause for concern nor low.
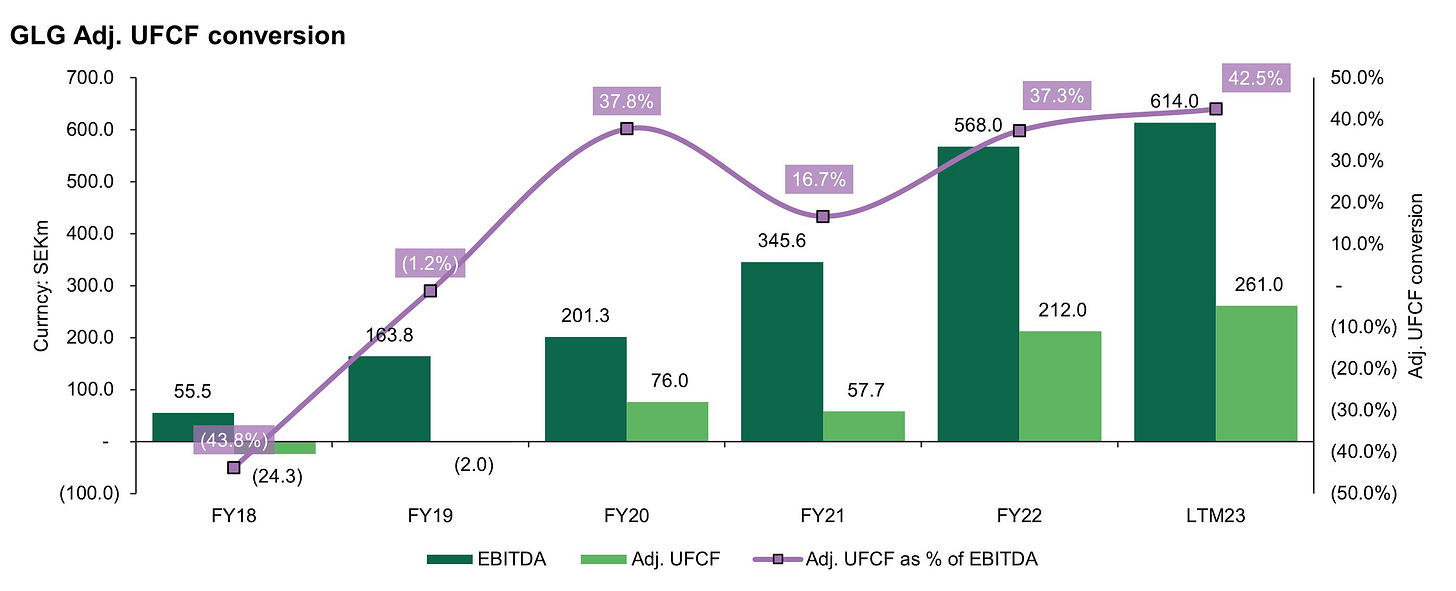
GLG’s cash flow has improved in-line with what can be expected looking at the PL items. UFCF margin (before leases) has improved from -2.1% in FY18 to 8.4% over the LTM period. UFCF per share has compounded at a 47.8% CAGR since FY19, while capex as percentage of revenue has averaged at 2% historically. However, the major caveat here is that margins are much lower if you adjust for financial leases. Converting these leases to an operational nature decrease UFCF margins by approximately 3ppt (5.0% over the LTM period). Looking at the relationship between reported EBITDA and a lease adjusted version of UFCF, cash conversion seems to range around 40% in a normalised situation. This is an important aspect to have in the back of your mind while looking at EBITDA numbers or multiples. While I still believe EBITDA development is a good proxy for the business, a good rule of thumb is to divide EBITDA numbers by 2.5 (or multiply EBITDA multiple by 2.5) in order to arrive at good enough estimation of cash flows.
Green Landscaping Group - Valuation
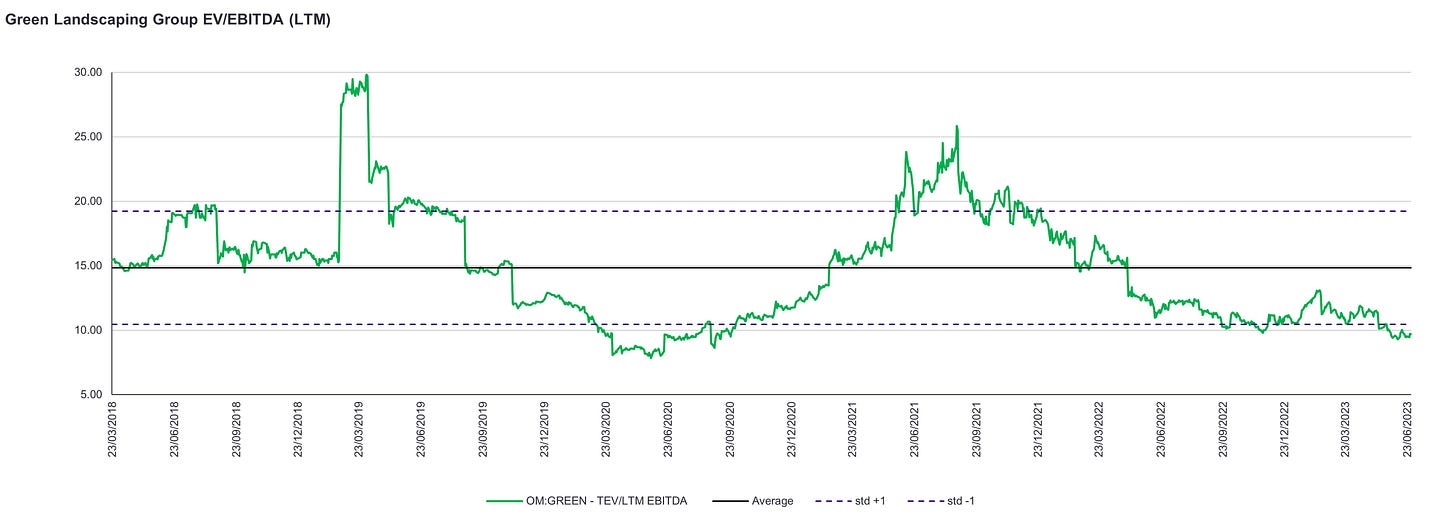
GLG currently trades at SEK 73 per share with a market cap of approximately SEK 4.2b, which according to my calculations corresponds to a 5% adjusted UFCF yield. The company trades <10x LTM EV/EBITDA on a reported figures, which is lower on a pro forma basis given recent acquisitions. From the graph below we can see that GLG is currently trading at a discount compared to its historic average from IPO (on a reported basis) and even below one standard deviation of the average.
So at a first glance, GLG might appear cheap. Below is a quick comparison screen against fellow landscaping stocks and service/installation businesses with an M&A approach. What stands out is that multiples overall are relatively low, which can be explained by the limited scalability of the business model combined with rather slim margins. Moreover, return on equity/capital/assets are modest across the board. Yet, what stands out to me is that GLG appears to be trading in-line or below peers, while boasting stronger growth rates, margins and capital returns than the average. This represents a discount that in my eyes seems unwarranted.
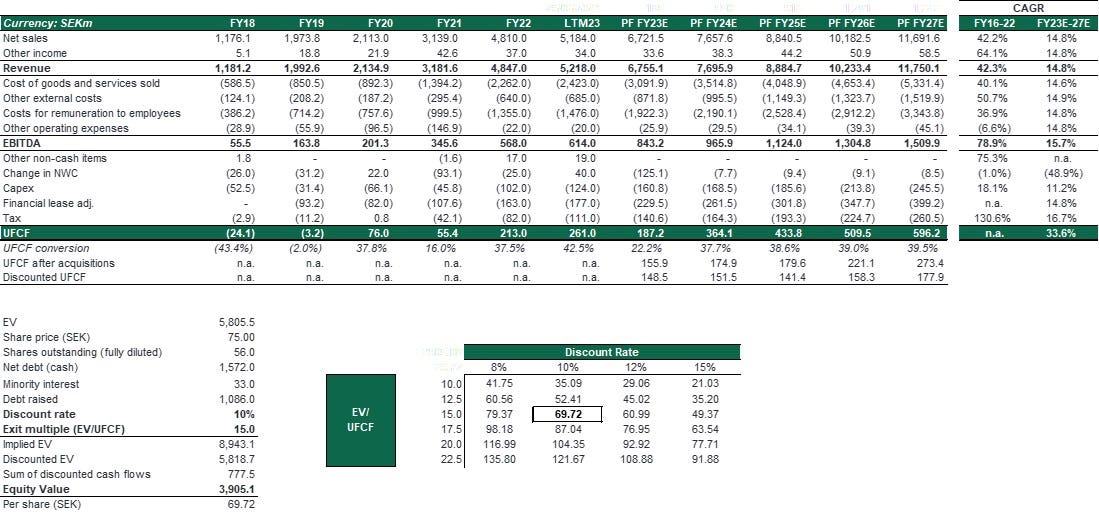
To isolate GLG and obtain a better grasp on potential forward returns, I’ve constructed a relatively straight-forward DCF that takes both organic and inorganic growth into account. The main assumptions from the model for the FY23E-FY27E period are:
5% organic combined with 10% inorganic net sales growth CAGR from FY24 and forward
Number of acquisitions to average around 9 per year with an average deal size of SEK 64m (i.e. SEK 100m in annual sales). Average paid multiples of 5x EBITDA and 0.6x sales.
Group EBITDA margin going from 11.8% to 12.9% in FY27E.
Capex to average 2.2% of net sales, NWC to decrease from 1.6% to 1.2% of net sales and financial lease payments steady at 3.4% of net sales.
UFCF conversion to average at 39% over time improving slightly year over year.
Combining these assumptions with a 10% discount rate and 15x pro forma UFCF exit multiple gives me a fair valuation of SEK 70. If the current trading multiple remains stable at exit, I believe there exists a good opportunity for >15% IRR given the company’s ability to grow free cash flow per share above this rate.
Green Landscaping Group - Conclusion
Green Landscaping Group is considered a leading player in a highly fragmented market, operating a decentralised structure that emphasises operational efficiency and profitable growth. The business presents in my opinion an attractive roll-up investment opportunity due to its stable market, potential for market consolidation, and growth prospects. With a focus on organic and inorganic growth, GLG has the ability to achieve sustained double-digit growth rates over a long period of time. Furthermore, the management team and board demonstrate a high level of competence and ownership, which further supports the company's prospects for success. While the company’s financials aren't exceptional given the business model and industry, it still supports plenty of opportunities for value creation. GLG is currently trading at historically low multiples and from my perspective an unwarranted discount to peers. Its current valuation suggests a potential for above market rate returns and a 15% IRR without relying on multiple expansion. Although I do not own the stock at the time of writing, I will seriously consider a position if it trades below SEK 70.
Disclaimer: I have no position in Green Landscaping Group at the time of writing this report. The information contained in this report shall not be understood or construed as financial advice. I am not a financial advisor, nor am I holding myself out to be, and the information contained in this report is not a substitute for financial advice from a professional. I shall not be held liable or responsible for any errors or omissions from this report or for any damage you may suffer as a result of failing to seek competent financial advice from a professional.

